.png)
What an exciting first year of activity for the Symphony Software Foundation! From a standing start a year ago, we’ve accelerated over the course of 2016 to become one of the larger open source communities within the financial services and technology industries. Now that the team, governance and processes are in place, we’re looking forward to building our momentum through 2017.
But first a look back - how did we do in 2016?
We recently prepared a 2016 retrospective for the Foundation’s Board of Directors, and I wanted to share some of that with the community, both as an objective measure of how we did, but also to give a sense of how we’ll be measuring ourselves for the coming year. And of course, I’d love to hear your feedback!
For those new to the Foundation, a reminder that we serve as a forum for two primary types of community collaboration:
“Projects” are typical open source software hosted by the Foundation and openly distributed under the Apache License Version 2.0. Anyone may host an open source project with the Foundation (provided minimal contribution criteria are met) - there are no fees involved, and contribution is not limited to Foundation members.
“Working groups” are more akin to traditional standards bodies, where industry experts meet to discuss and prepare standards, best practices and position papers. The audience of these deliverables are the Foundation’s open source project teams, the Foundation’s Engineering Steering Committee (ESCo) and/or board and, in some cases, the industry at large.
We at the Foundation consider this combination to be one of our unique advantages - we bridge the often siloed worlds of code-first developers and talk-first standards enthusiasts. When properly orchestrated, this meet-in-the-middle approach delivers superior results.
Of course, we measure our success by how well both types of bodies are operating, as well as how well the advisory bodies (such as the ESCo) are functioning.
Project metrics
The easiest and, in some respects, the most important “top-line” metric the Foundation tracks relates to the overall project portfolio - both in terms of how many projects we’re hosting, as well as the activity and maturity level of those projects (where maturity is formally identified via the Foundation’s project life cycle).
As shown in Figure 1, between May (when our first project was contributed) and the end of 2016, we hosted a total of 44 projects in our GitHub organization, of which one subsequently became active and three were archived.
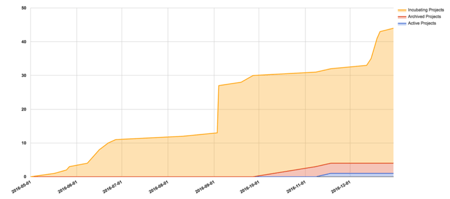
Figure 1 - Hosted project count by state
The noticeable jump in September came from the contribution of 17 individual bots developed by Symphony Communication Services LLC (Symphony) as part of an internal hackathon for interns and new employees. Details of these projects can be seen in the contribution issue that initiated their hosting with the Foundation.
Ignoring those bots, this graph shows steady growth in the portfolio throughout the year, with an unexpected uptick in the December “dead zone.” A nice holiday gift, indeed!
Now while a top-line project count is good for giving a thirty thousand foot view of the growth in the portfolio, commit activity is a more substantive measure of the health of those projects.
Figure 2 shows commit activity per week for the same time period, and after an initial flurry of activity (some of which came from Foundation staff members establishing infrastructure), we can see that sustained community commit activity really started in late October.
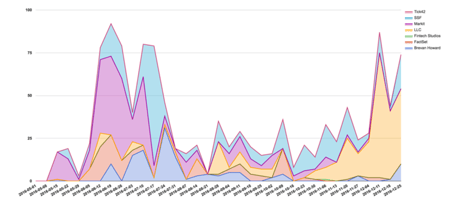
Figure 2 - Commits per week per organization
Not unexpectedly, Symphony’s development work has grown to dominate the Foundation’s overall commit activity. What’s a little more surprising (to me, at least) is the relatively small number of organizations who contributed to Foundation-hosted open source during 2016.
While a lot of this has to do with the typically lengthy time it takes legal teams in large organizations to review and execute a Contributor License Agreement, this is also partially cultural - in the world of financial services, where information equates to competitive advantage, openness (and the confronting transparency that goes along with it) is far from the default mode of operation. The Foundation recognizes these challenges, and sees solving them to be key to driving change in the industry. We will continue working on ways to change this status quo over the course of 2017 - stay tuned!
Working group metrics
Working groups are somewhat harder to measure, both because they generally don’t use analytics-capable systems for the bulk of their work (unlike projects, which use GitHub extensively), and because their outcomes are typically also harder to measure. The size of a standards definition or best-practice document is generally not correlated with the amount of time and effort that went into constructing it.
For that reason, the Foundation has, to date, reported mostly on participation as a crude proxy for outcomes and, as seen in Figure 3, participation was reasonably steady throughout 2016.
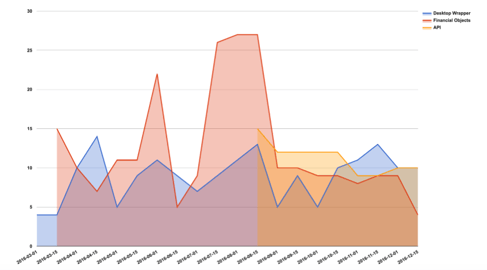
Figure 3 - Participation per working group
We can clearly see that the Financial Objects Working Group has been more “bursty” in its activity, while the other two working groups have had more steady participation.
A pattern that caught my eye in Figure 3, which is more prominent when participation is totaled across all working groups (as shown in Figure 4), is that despite there being somewhat of a downward trend in participation in each individual working group from around the time the API Working Group first convened (August), the total participation rate has stayed roughly the same - in fact, a crude linear trendline for the year shows steady growth.
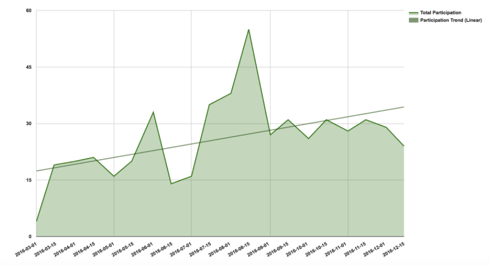
Figure 4 - Total working group Participation
What this suggests is that, at least in 2016, the member organizations have had a fairly fixed-size pool of individuals who are able and willing to participate in the Foundation’s working groups. In other words, when a new working group forms (as the API Working Group did in August), they cannibalized some participation from the two existing working groups.
The good news is that overall participation in working groups shows slow but steady growth; a possible caution is that the membership may wish to temper their enthusiasm for new working groups with the realization that they appear to have a limited pool of motivated individuals who can participate across all working groups - adding more working groups simply divides that pool more finely.
“Vanity” metrics
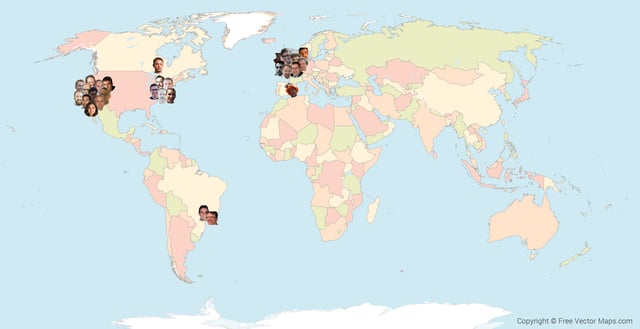
Everyone loves eye-candy vanity metrics, and a favourite amongst open source communities is a contributor map - a first attempt at ours is shown in Figure 5. Please note that not all active contributors have been shown - in many cases, I was unable to determine a contributor’s location or I couldn’t find a suitable avatar image.
 World with Countries - Multicolor by FreeVectorMaps.com
Figure 5 - Contributor locations
It should come as no surprise that most of our active contributors are based in either the two financial hubs (London and New York City), or the innovation hub (Silicon Valley), with a smattering of contributors scattered elsewhere.
In the spirit of inclusion and diversity, I certainly hope to see more happy faces on many more locations on the map this time next year!
Conclusion
Not surprisingly, the data clearly shows that 2016 was a formational year for the Foundation. The team spent it understanding the needs and preferences of the community and establishing appropriate governance and processes to support them. We also hosted the first projects (in May) and formed the first working groups (in March), and grew both substantially over the remainder of the year.
2017 promises to be the year we hit our stride and focus more on executing and less on groundwork. As in 2016, numbers will continue to play a central role in directing our team and community focus in all aspects of our community facilitation role.
Finally, some asks of you...
I would love to hear your feedback on these metrics and status reporting in general. We are currently investigating what it would take to provide soft real-time metrics (initially for projects) to project teams, the community, the ESCo and ultimately, the Foundation Board, and have identified a number of intriguing solutions in this space.
Without “leading the witnesses,” I’d very much appreciate hearing what metrics you’ve used on your development projects (whether open source or not), and also what tools and techniques you’ve enjoyed success with. While there is some prior art in this area, it’s mostly in the form of general guidance, and we’d appreciate concrete technical and procedural input from you, our community, as well.
Also, I spent way too much time constructing the contributor map manually and would love to find out that there are automated tools that do this kind of thing. I have to assume something like this exists somewhere, but my google-fu is apparently weak as I was unable to find anything suitable.
Finally, we’d love to see your face on the map! If you have an interesting idea for an open source project on Symphony or for something generally useful for our community, we’d love to host it and support your development and visibility.
It’s as simple as filing an issue! And don’t forget to reach out to our community on our dev list, we’d love to hear from you!